


The Move Math Engine
Someone in New Jersey just got an offer for $145,000 in Raleigh. On paper it reads like a $30,000 raise.
Whether it actually is one depends on about nine variables, and no product on the internet calculates them together.
State income tax. A three-bedroom within 45 minutes of the office. Two daycare slots. A second car, because the transit that made one car workable in Montclair doesn't exist there. Property tax at a different millage rate. Homeowners insurance in a ZIP code where carriers have been quietly thinning their books. The commute days that survive a hybrid schedule. Utilities in a climate that runs air conditioning eight months a year.

Today that family answers those questions the same way everyone does. Zillow for housing. Google Maps for the drive. Reddit for whether the neighborhood is actually nice. Niche for schools. FEMA for flood zones. A daycare directory for waitlists. A cost-of-living calculator for a citywide index that averages a metro of 1.4 million people into a single number. Then they build a spreadsheet, guess at the missing cells, and hope they didn't overlook the variable that eats the raise.
The data aren't hidden. They have simply never been assembled into one answer for one specific household. That gap is the business.
Here's the shape of it:
The money: 500 reports a month at $39 is $19,500. Forty B2B accounts at $499 average is another $20,000 in MRR on top.
Inside:
• Eight-week build scope for a solo founder
• Every input source, free and already public
• Four-tier pricing: $39 brief to $2,500 API
• The insurance-freshness moat and three more
The product is a household balance sheet attached to a map. It starts as a report business two people can run profitably and grows into a recurring B2B data product. Venture scale isn't the natural destination here, and pretending otherwise would obscure the strongest version of the business.
Every ranking answers the wrong question
The internet is saturated with geography scores, and they're all built the same way.
Niche blends cost of living, schools, crime, jobs, nightlife, diversity, and weather into a letter grade. Sperling's BestPlaces compares cities across housing, food, transportation, healthcare, and taxes. Walk Score rates walkability. NeighborhoodScout sells granular crime, housing, and demographic reports nationwide, and it's the closest thing to proof that people will pay for this data: roughly $30 unlocks a single location report, subscriptions start at $125 a month and climb to $400, and enterprise licensing is quote-only.
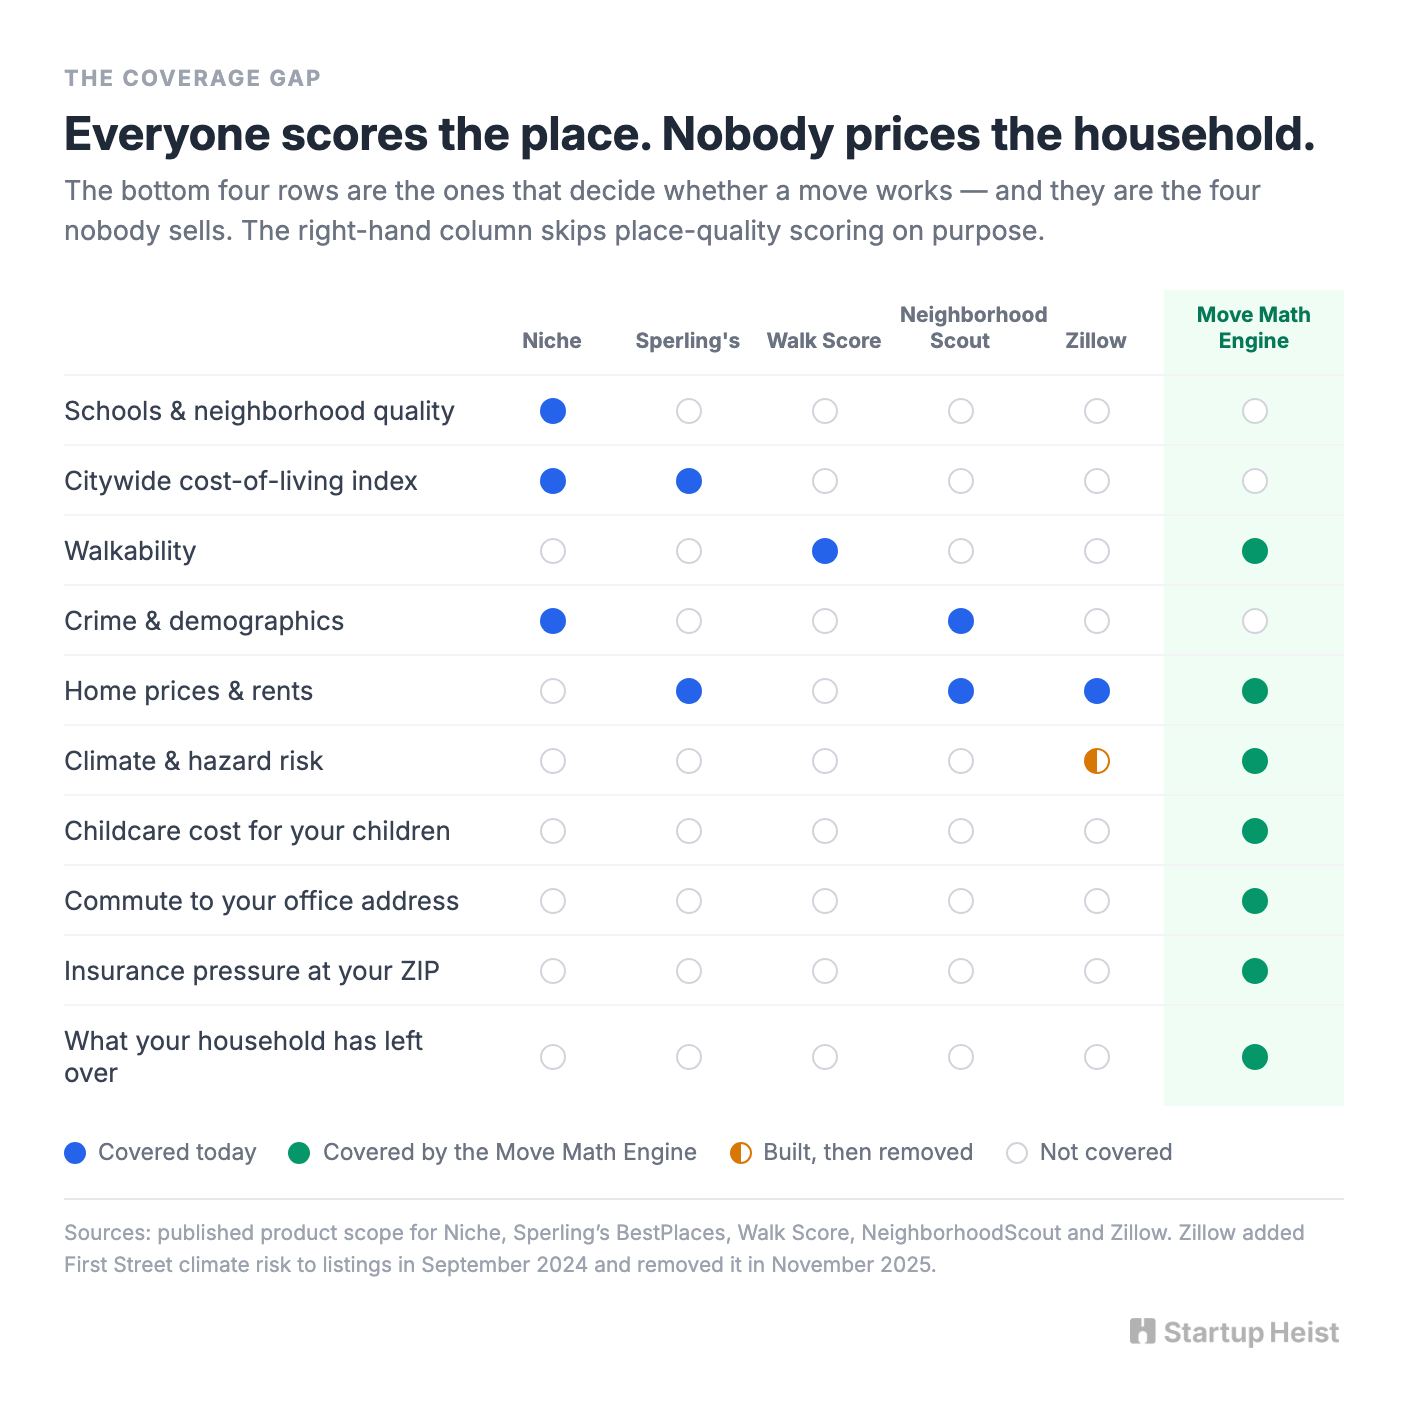
These are competent products, and they answer two real questions. What is this place like, and how does it compare to that one.
None of them answer the third: what happens to your household's finances if you move there.
The gap isn't cosmetic. A metro can post an attractive cost-of-living index and still be unaffordable for a family that needs two infant slots and proximity to one specific hospital. A suburb can grade out beautifully on schools and safety while putting both parents in 70-minute cars. Cheap houses on the Gulf Coast can carry a monthly housing payment higher than the expensive metro the family just left, once wind and flood coverage and deductibles are counted.
Averaging is what breaks them. Every generic score smooths away the exact variables that decide whether a move works.
The right product refuses to name a best place. It says: here are the eleven counties that clear your financial floor, here is your expected monthly remainder in each, here is what you give up, here is where our data are solid, and here is the one number you need to go verify yourself before you sign anything.
That's a decision product. What's on the market today is content with a map attached.
Zillow blinked
In September 2024, Zillow put climate risk data on every listing. Flood, wildfire, wind, heat, and air quality, sourced from First Street, displayed right on the page. The company's own framing was that buyers needed this to understand long-term affordability and plan for insurance costs.
In November 2025, Zillow pulled it. The California Regional MLS had challenged the accuracy of First Street's flood models, and agents complained that risk labels were costing them sales. What remains is a link out to First Street under a heading. Redfin kept its climate features and said so publicly.
The accuracy objection is real and worth taking seriously. It was also extremely convenient. The largest real estate portal in America built the exact feature this business depends on, proved it was technically feasible, and removed it when the people who pay its bills objected. Portals are funded by the sell side. A product that tells a buyer "this house is fine but the insurance is going to be a problem in four years" is structurally hostile to the business model that funds the platform showing it.
Data can be licensed by anyone. An incentive that stops your largest competitor from shipping the feature at all is far more durable.
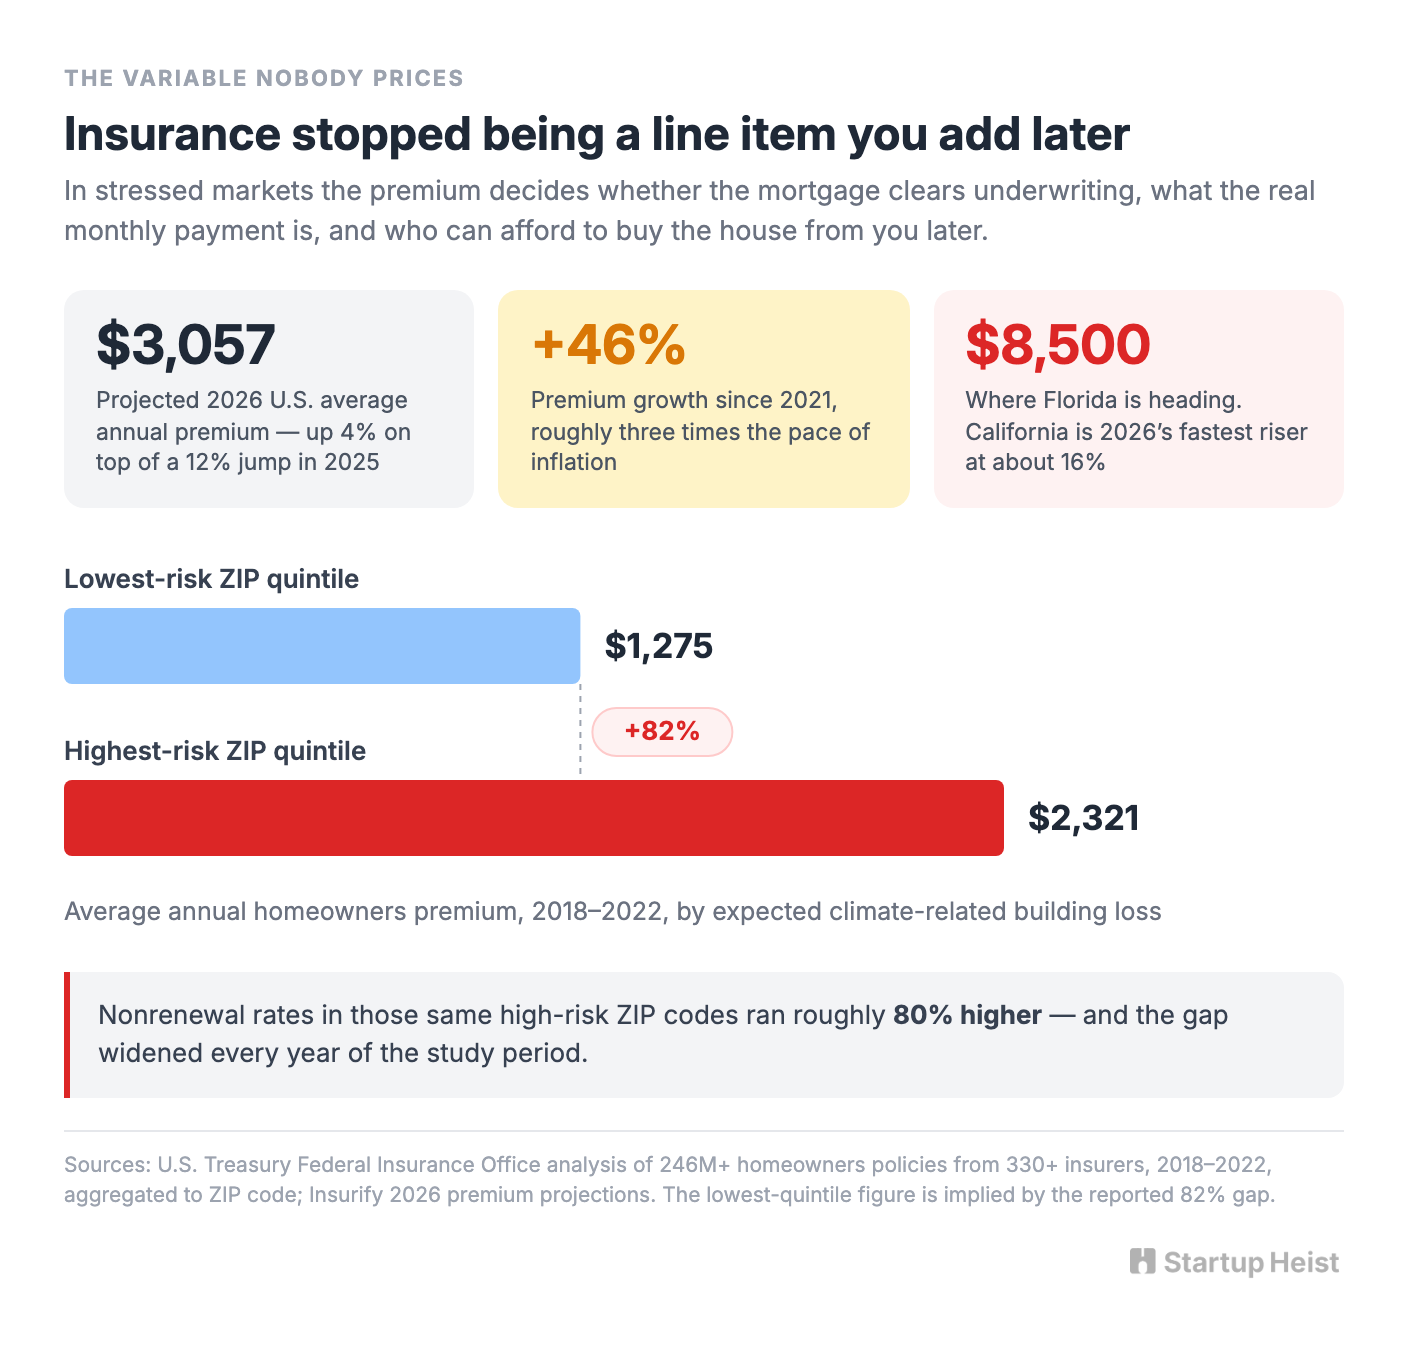
Meanwhile the underlying numbers keep getting worse. Treasury's Federal Insurance Office analyzed more than 246 million homeowners policies from over 330 insurers covering 2018 through 2022, aggregated to the ZIP code. Households in the 20% of ZIP codes with the highest expected climate-related building losses paid $2,321 on average, 82% more than households in the lowest-risk quintile. Nonrenewal rates in those same ZIPs ran roughly 80% higher, and the gap widened over the period.
Since then it has accelerated. Insurify projects the national average homeowners premium reaching about $3,057 in 2026, a 4% rise on top of a 12% jump in 2025. Premiums are up roughly 46% since 2021, about three times the pace of inflation. Florida is heading toward $8,500. California is 2026's fastest riser at roughly 16% following the Los Angeles wildfires, and Nebraska, New Mexico, and Georgia all clear 10%. This stopped being a coastal story.
Insurance is no longer a line item you add after picking the house. In stressed markets it decides whether the mortgage clears underwriting, what the real monthly payment is, and who can afford to buy the house from you later.
The data are about to get much better. At its Spring National Meeting in March 2026, the NAIC issued a nationwide homeowners market data call covering policy years 2018 through 2025: ZIP-level premiums, claims and losses by peril, deductibles, cancellations, nonrenewals, coverage limits, and mitigation discounts from every insurer writing at least $50,000 in relevant premium. Submissions were due July 15, 2026, after a one-month extension. A public report is planned for early 2027. Several states are already ahead. California publishes ZIP-level counts of new, renewed, and nonrenewed residential policies, and Florida collects monthly residential policy data down to the county and ZIP.
The raw material is arriving. The consumer decision layer that sits on top of it doesn't exist, and the company best positioned to build it walked away from the job on purpose.
The number that replaces the score
The output is a single number the household already understands.
Unlock the Vault.
Join founders who spot opportunities ahead of the crowd. Actionable insights. Zero fluff.
“Intelligent, bold, minus the pretense.”
“Like discovering the cheat codes of the startup world.”
“SH is off-Broadway for founders — weird, sharp, and ahead of the curve.”


