


The Shelf-Shuffle Heist
A shopper walks into a convenience store for coffee.
A spreadsheet assumes the trip is simple. Entrance, coffee machine, checkout. The shortest path wins.
The shopper does something else. He pauses at the drinks fridge. He drifts past the bakery case. He doubles back because another customer is blocking the aisle. He notices a basket of snacks by the register. His route isn't the shortest one, and it isn't a straight line either. The gap between how he actually moves and how the spreadsheet thinks he moves is where the opportunity lives.
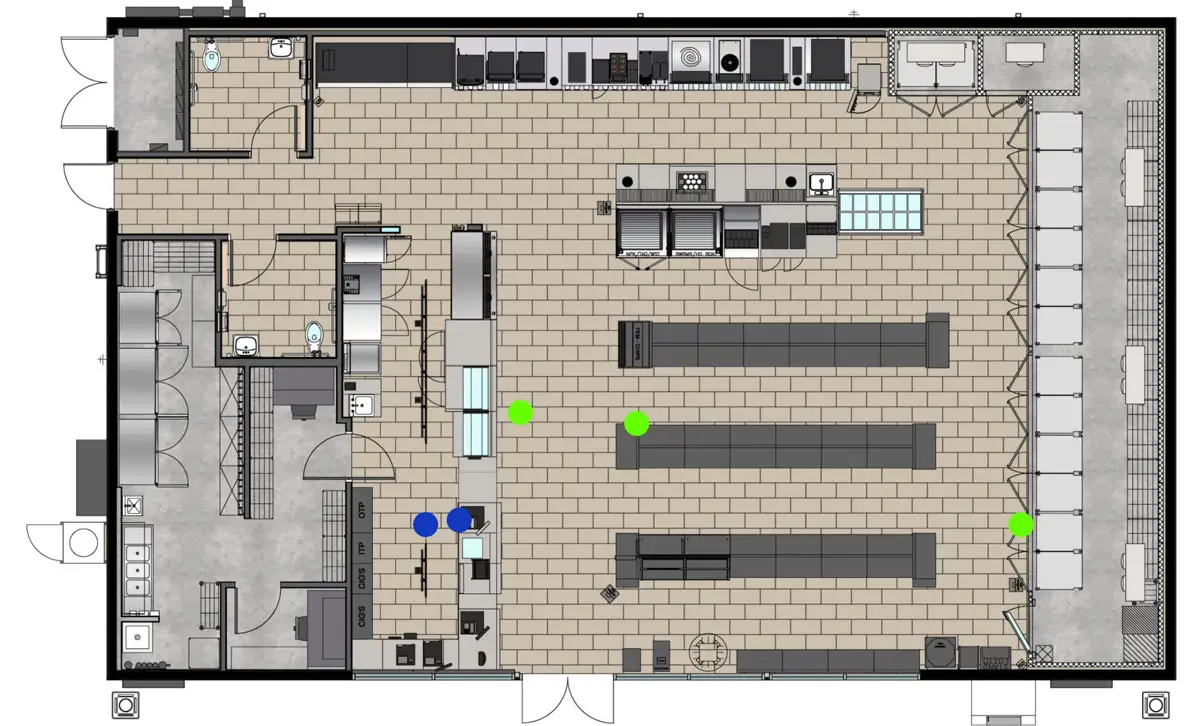
A May 2026 paper presented at the International Conference on Autonomous Agents and Multiagent Systems modeled how customers actually move through a real convenience store. The authors reported that real shopper routes deviated from shortest-path estimates by roughly 28% on average. Their reinforcement-learning model produced more believable traffic patterns than the usual heuristics, and in a small product-repositioning test, it recommended a shelf placement comparable to the one you'd derive from real trajectory data. They released the code, the supplementary material, and a playable digital twin of the store.
None of this proves a solo founder can build an autonomous retail-optimization platform. The study was narrow: one store, one customer type, one impulse-product move. The authors themselves note that robust policies are expensive to train and need retraining when a layout changes.
What it points at is a smaller, more useful business. Build a micro-SaaS that turns a floor plan and a POS export into the next three merchandising experiments a small retailer should run. No store redesign. No cameras. No enterprise planogram software. Three sensible tests for next week, a printable instruction sheet for staff, and a clean way to see whether the change worked. Call it ShelfShuffle.
Here's the opportunity:
The money: 100 locations at $79/month is $7,900 MRR; 300 is $23,700. A market of 95,672 small-operator stores with no incumbent.
Inside:
• Full MVP scope: five screens, store model
• Sprint-to-subscription pricing ladder
• 90-day concierge-to-product playbook
• Cold outreach script that books pilots
The analytics gap
Physical retail runs on instinct at the bottom of the market.
Big chains buy planogram systems, store-design consultants, traffic sensors, video analytics, and centralized merchandising teams. A single-location convenience store, specialty grocer, bakery, or bottle shop buys none of that. The owner still has to decide whether the protein snacks belong next to the cold drinks, whether the bakery case is wasting its best impulse spot, and what staff should move before the weekend rush.
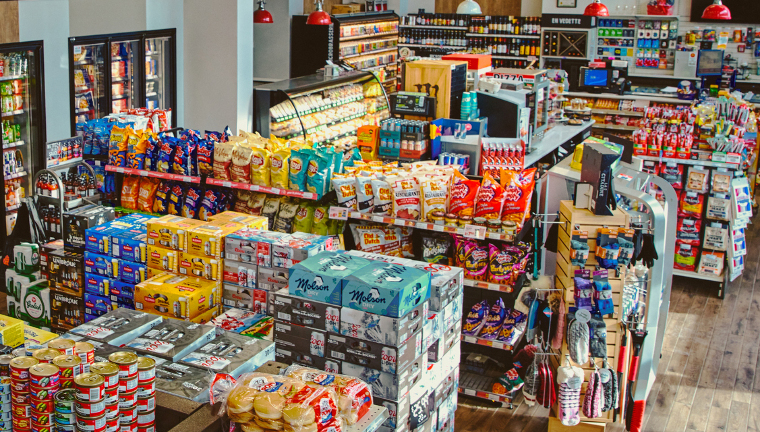
The usual answer is intuition, a supplier's suggestion, or a spreadsheet. Each has a flaw. Experienced operators notice things software misses, but intuition is hard to test. Supplier recommendations tend to optimize the supplier's shelf, not the store's margin. Spreadsheets overweight sales history and ignore how customers physically encounter a product in the first place.
Reinforcement learning didn't solve retail. What changed is that believable shopper simulation got cheap enough to power a lightweight decision tool. The paper's StoreGrid environment treats the store as a two-dimensional grid, with shelves, products, checkouts, and trajectories mapped into the space. Its maximum-entropy approach models bounded rationality: shoppers chase a goal, but they wander to get there. That's enough to answer one practical question. Given what this store sells, where things sit, and how customers plausibly move, which three low-risk layout experiments are worth running next? The answer doesn't need to be perfect. It needs to beat guessing.
Why convenience stores first
Don't start with "physical retail." Start with convenience stores, small groceries, specialty food shops, and compact markets that mix planned and impulse buying.
The math is unusually friendly. The U.S. had 151,975 convenience stores at the start of 2026, and 63% of them were run by companies with ten or fewer locations. That's a rare combination: a large independent-operator base with a recurring operational problem and no incumbent serving them. The revenue pool is real, too. U.S. convenience foodservice and merchandise sales hit $341.2 billion in 2025, up 1.7% on the year, with foodservice alone driving 28.5% of in-store sales and 38.9% of in-store gross profit.
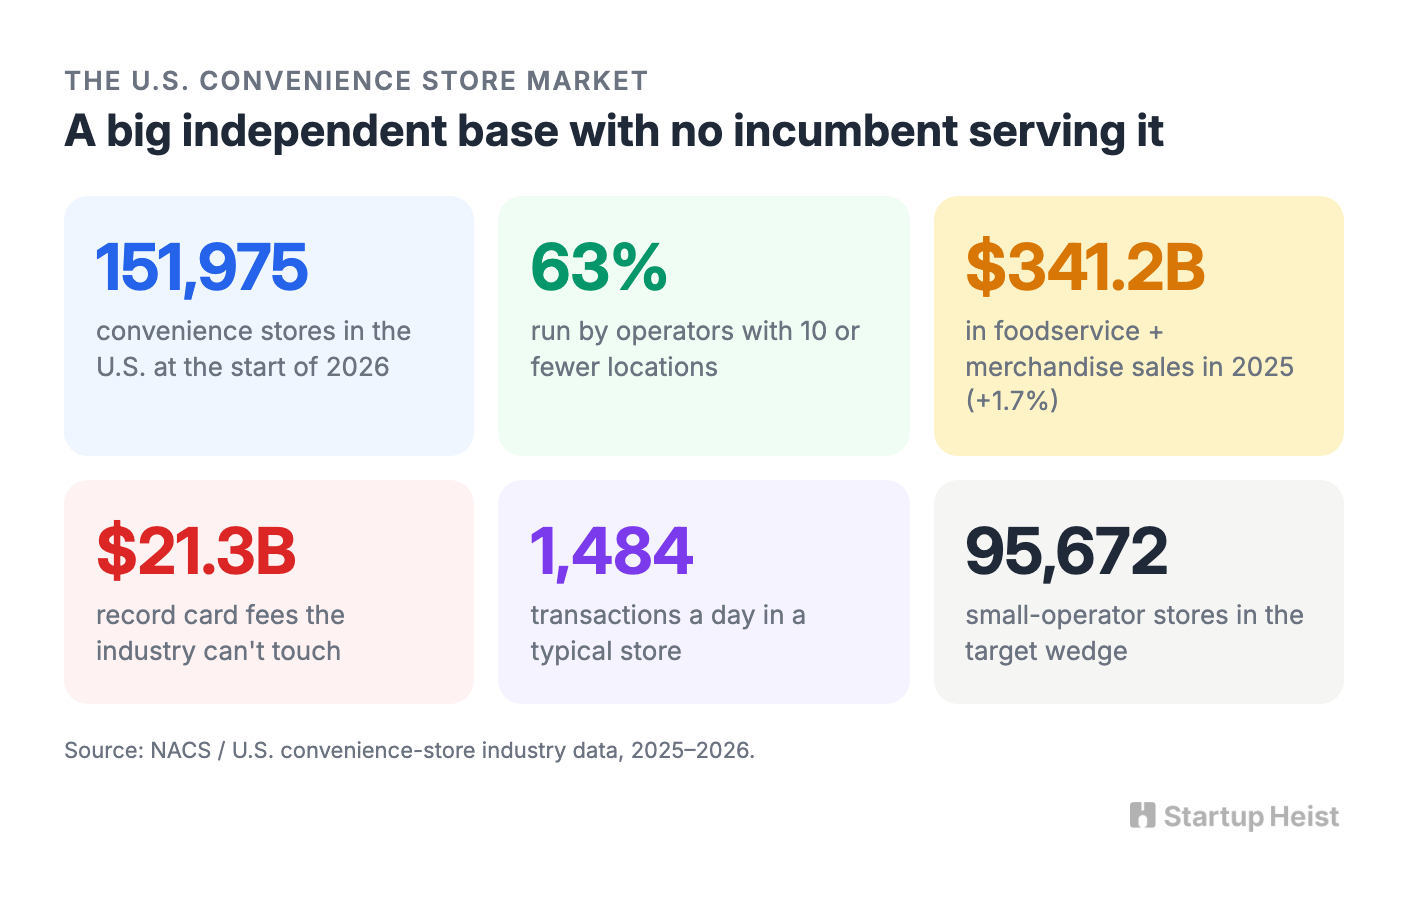
The owner isn't shopping for "AI." The owner is hunting margin, and the pressure is rising. Direct store operating expenses climbed 4.2% in 2025, and card fees set a record at $21.3 billion across the industry. A small retailer can't touch interchange or wage inflation. He can test whether his best add-on is sitting in the wrong place. With a typical store running roughly 1,484 transactions a day, ShelfShuffle doesn't need a dramatic lift to pay for itself. A few extra high-margin impulse buys a day clears a modest subscription.
The whole pitch is an experiment engine, not an optimization oracle, and it should be sold that way.
The product: three tests, not a dashboard of homework
The promise fits in one sentence. Upload your store map and POS exports, get three layout experiments for next week with staff instructions and a scorecard.
Version one generates three kinds of recommendation.
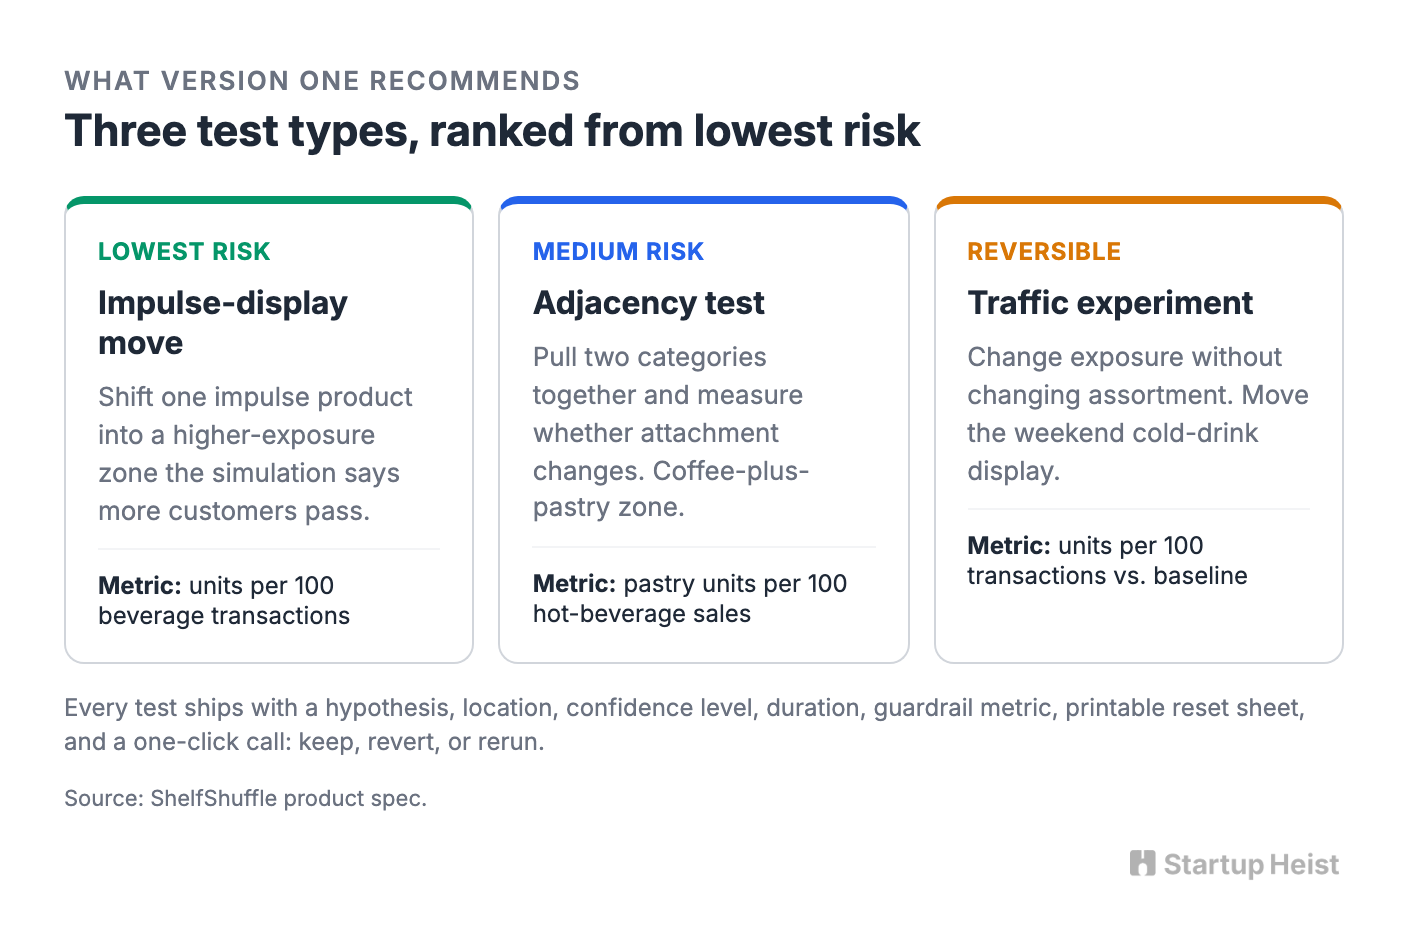
The first is the impulse-display move: shift one product or category into a higher-exposure zone. "Move the single-serve protein snacks from the back wall to the open fixture beside the cold-drinks route for seven days. Track units per 100 beverage transactions." This is the cleanest place to start because it carries the least risk. You aren't rearranging essential categories or rebuilding the store. You're moving one impulse item into a spot the simulation says more customers pass. The paper's repositioning exercise follows exactly this logic: find a profitable impulse product, place it on frequently visited empty shelves, and leave the essentials alone since those are often what pull shoppers deeper into the store.
The second is the adjacency test: pull two categories together and measure whether attachment changes. "Create a coffee-plus-pastry zone near the morning checkout path. Measure pastry units per 100 hot-beverage transactions, before and after." The software shouldn't say "put complementary products together." Every owner knows that. The value is a specific hypothesis, a proposed location, a measurement window, and a metric.
The third is the low-risk traffic experiment: change exposure without permanently changing the assortment. "Move the weekend cold-drink display six feet closer to the entrance and rotate it toward the checkout approach. Measure units per 100 transactions against weekday-adjusted results." Endcap moves, temporary displays, queue-line fixtures, basket placement, signage, and small seasonal zones all live here.
Every recommendation ships with the same envelope: the exact items involved, current and proposed locations, the business hypothesis, a confidence level, a test duration, a primary metric, a guardrail metric like stockouts or cannibalization, a printable reset sheet for staff, and a one-click decision at the end. Keep, revert, or rerun. The product earns its keep when it turns a fuzzy merchandising question into a weekly routine.
What the customer uploads
The first sellable version asks for less than you'd think. For each location: a store map (a floor-plan PDF, a rough sketch, even a photo of a hand-drawn layout), entrances and checkouts, the shelf and fixture and fridge zones, the product categories assigned to those zones, a catalog export, and four to eight weeks of transaction-level sales. Opening hours, promo notes, stockout flags, and a couple of manual traffic counts are optional bonuses.
Don't require item-by-item shelf dimensions at onboarding. That turns a quick experiment tool into a planogram implementation project. Don't require cameras. Don't require a demo-pretty digital twin that takes days to build.
The POS wedge is credible because the exports already exist. Square lets sellers export reports, transaction detail, and item libraries as CSV. Lightspeed Retail exports sales history as CSV and product lists as CSV or XLSX. Clover supports spreadsheet inventory imports and a bulk Export API for installed apps. The data will be messy. Categories will clash. One owner will upload "Coke 20 oz," "Coca Cola," and "Coke bottle" as three different items. That mess is part of why the market is still open, not a reason to avoid it.
What to build first
The mistake would be starting with a sophisticated reinforcement-learning product. Start with a services-assisted app that produces good experiments using a blend of simulation, rules, and human review.
Unlock the Vault.
Join founders who spot opportunities ahead of the crowd. Actionable insights. Zero fluff.
“Intelligent, bold, minus the pretense.”
“Like discovering the cheat codes of the startup world.”
“SH is off-Broadway for founders — weird, sharp, and ahead of the curve.”


