


The Interactive Explainer Layer
In September 2026, a developer named Dmitry Brant put a strange physics experiment on the web. He called it Relativity Park, and it asks what the world would look like if light traveled at 5 kilometers per hour, a brisk walking speed, instead of 299,792 kilometers per second.
You look around with the mouse and move with the WASD keys. Once you start walking, the world ahead of you turns blue and the world behind turns red, and everything in front of you squeezes shorter. Two clocks in the bottom-right corner, one for you and one for the world, drift apart as you move. You can raise the speed of light to 40 km/h or drop it to 1. MIT's Game Lab explored the same idea in 2012 with a game called A Slower Speed of Light. Brant wanted something lighter, so he wrote his version in plain JavaScript and WebGL to run in a web browser. You never read a sentence about time dilation. You watch your own clock fall behind.

Interactive content of this kind has beaten the news before. On December 21, 2013, The New York Times published "How Y'all, Youse and You Guys Talk," a dialect quiz built by Josh Katz, a statistics graduate student at NC State, during his fall internship with the paper's graphics department. Within about eleven days it became the most-visited piece of content on NYTimes.com for 2013, ahead of coverage of the Boston bombings, the new Pope, and a Putin op-ed. Tens of millions of people took it, because it handed each of them a map of how they themselves talk.
Few writers can build anything like that. Personal-finance bloggers, Substack and Ghost newsletter writers, consultants, and teachers explain numerical ideas every week, and they do it with paragraphs and a static chart. The opportunity is a template-first, no-code tool that turns their calculations, tradeoffs, and scenarios into polished interactive explainers on the web, with an auto-generated image that pulls email readers into the live version. Think Canva, except instead of designing an infographic about compound interest, you publish the compound-interest model itself.
The short version:
The money: 500 Creator accounts at $19 a month plus 100 Pro accounts at $49 is $14,400 MRR. Custom builds at $250 to $750 each fund the template library.
Inside:
• Ten launch templates and four outputs per widget
• A 90-day plan from prototype to paid plans
• The cold email that recruits design partners
• Pricing tiers plus a $250-$750 build service
The gap between writing and touching
The publishing stack is mature for almost every format. Substack and Ghost handle newsletters. WordPress handles anything. Canva makes static graphics, Descript edits video, Typeform runs forms. The missing piece sits between writing an idea and letting the reader operate it.
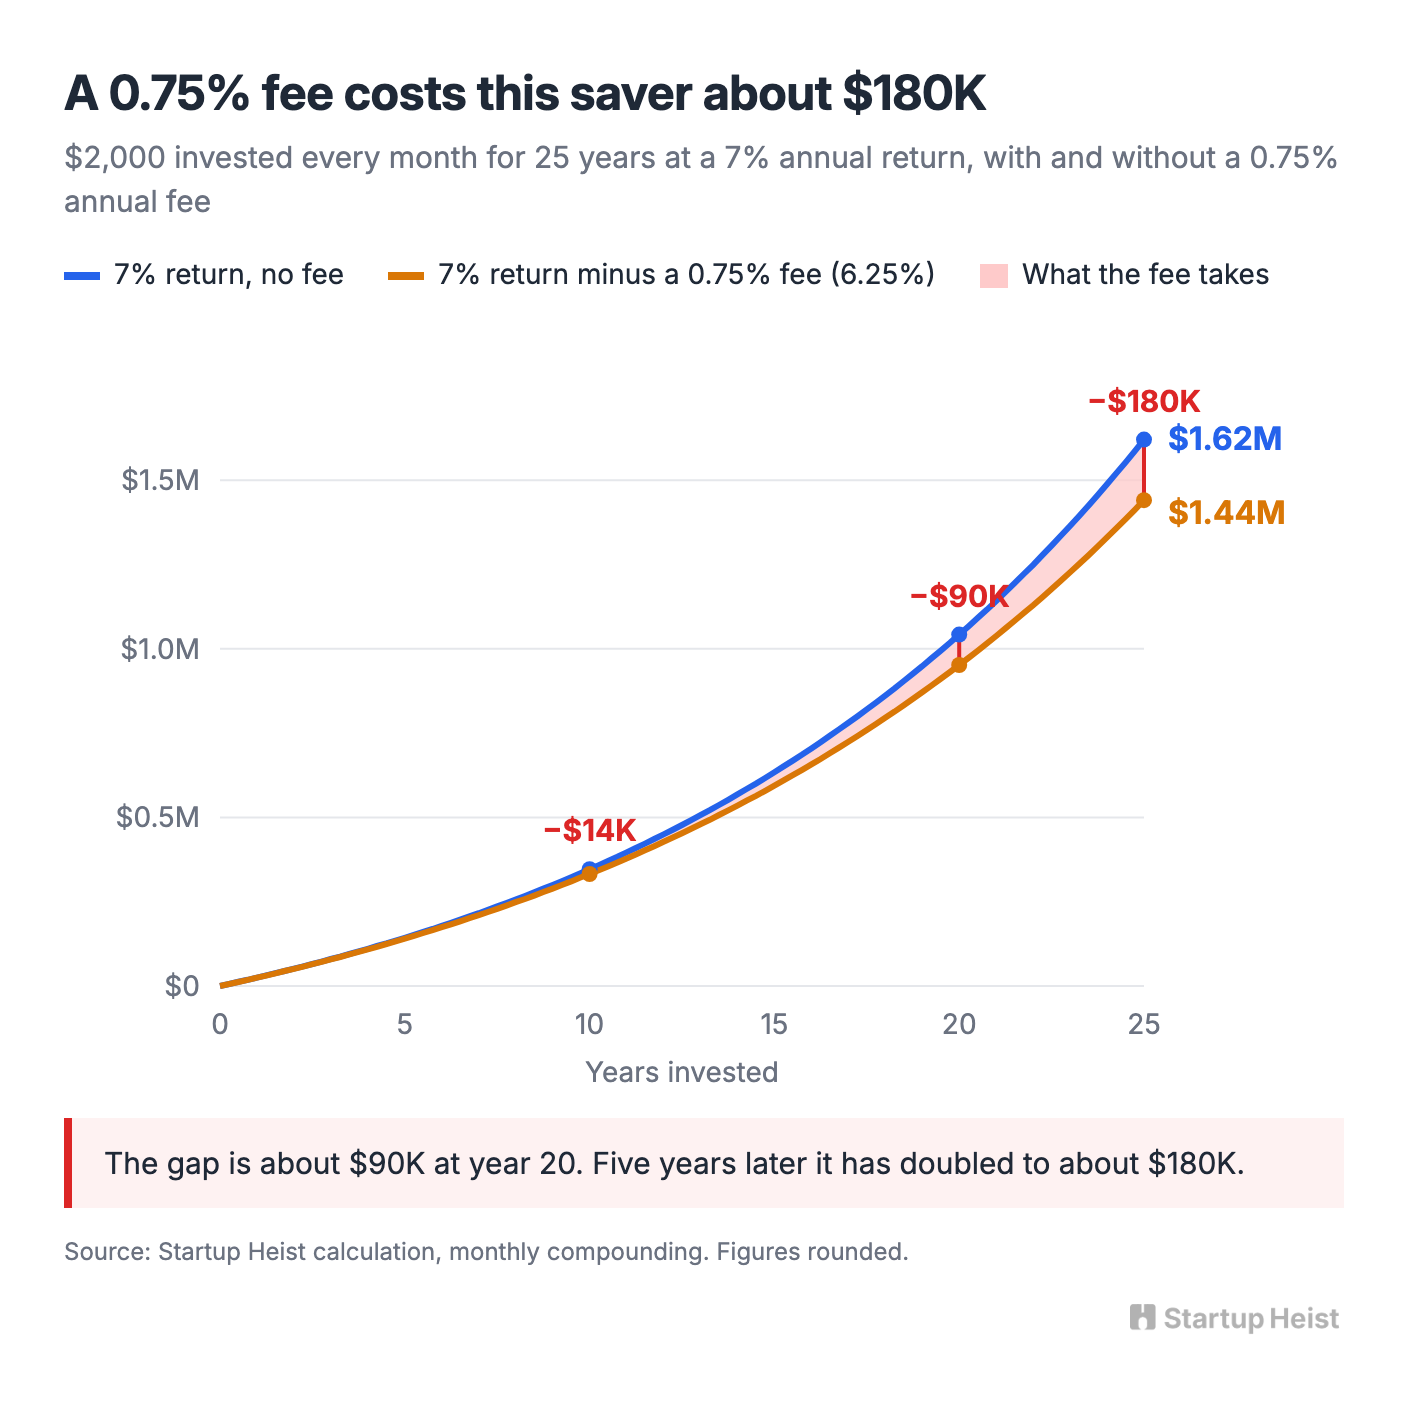
Take a finance writer publishing "A 1% fee could cost you more than you think." The usual version explains the math in prose and shows one chart for one hypothetical saver. The interactive version lets the reader enter their own portfolio, monthly contribution, expected return, time horizon, and fee. Someone investing $2,000 a month for 25 years at a 7% return ends near $1.62 million. Add a 0.75% annual fee and the same saver ends near $1.44 million, about $180,000 lighter. On the page, $180,000 is a figure a reader nods at and forgets. When they drag the fee slider themselves and watch the gap open with every notch, they start thinking about their own account.
The same move works across categories. A startup newsletter lets readers raise churn and watch runway shrink. An economics professor lets students drag supply and demand curves. A consultant puts an ROI model beside the article that describes the problem. Designers call the format an explorable explanation, and browsers have handled it for a decade, yet producing one still requires a developer or a calculator tool designed for lead capture. A company can be built in that mismatch.
The email problem is the product
One technical fact should shape the whole company: the interactive part can't live inside the email. Modern email clients automatically disable iframes and JavaScript for security. Ghost's own help documentation says there is no way to make a dynamic embed work in email and recommends a workaround: screenshot the embed, insert it as an image card, and link it to the live post. Substack is stricter still. Its editor accepts no custom embed code at all and only auto-embeds a set of recognized link types.
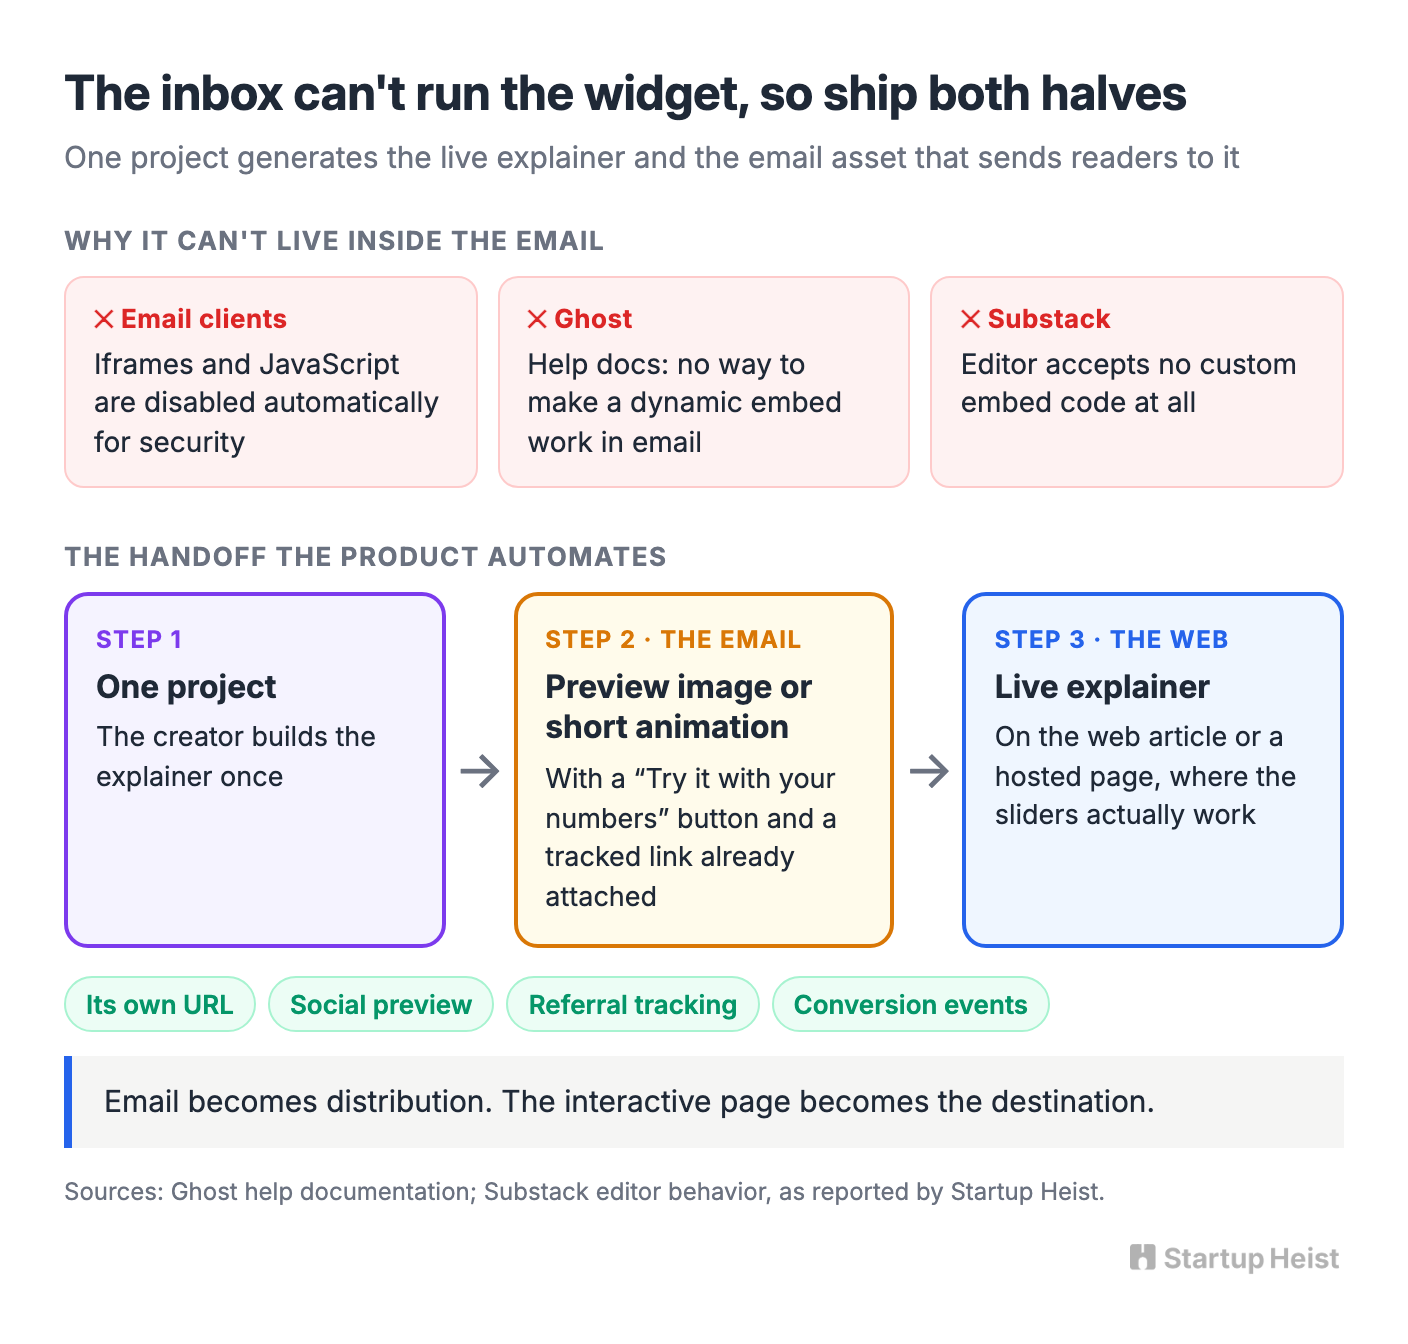
So never sell "interactive calculators inside your newsletter." You'd spend years explaining why Gmail broke them. Build the workaround into the product instead. The live explainer sits on the web article or a hosted page. The email carries a polished preview image or short animation with a "Try it with your numbers" button. The tool generates both from the same project, and the creator pastes one asset into their newsletter with the tracked link already attached.
This handoff is commercially stronger than the impossible version would have been. Every explainer gets its own URL, social preview, referral tracking, and conversion events. Email becomes distribution, and the interactive page becomes the destination, which is exactly where a creator wants readers to land.
Calculators are cheap; explanations aren't
The obvious pitch, "we're the cheap calculator builder," is already dead. Outgrow starts at $14 a month billed annually, and its plan with unlimited content pieces runs $95 a month billed annually. Calconic's entry plan costs $5 a month billed annually. ConvertCalculator sells a $20 Hobby tier, Typeform's Basic plan runs under $30 a month billed annually, and involve.me starts at $29. Omni Calculator lets anyone embed its 3,800-plus calculators for free in exchange for a visible logo and link, and 8 million unique users visit its site every month. Claude and ChatGPT will both generate a working slider on request, and Claude can publish one with embed code generated automatically.
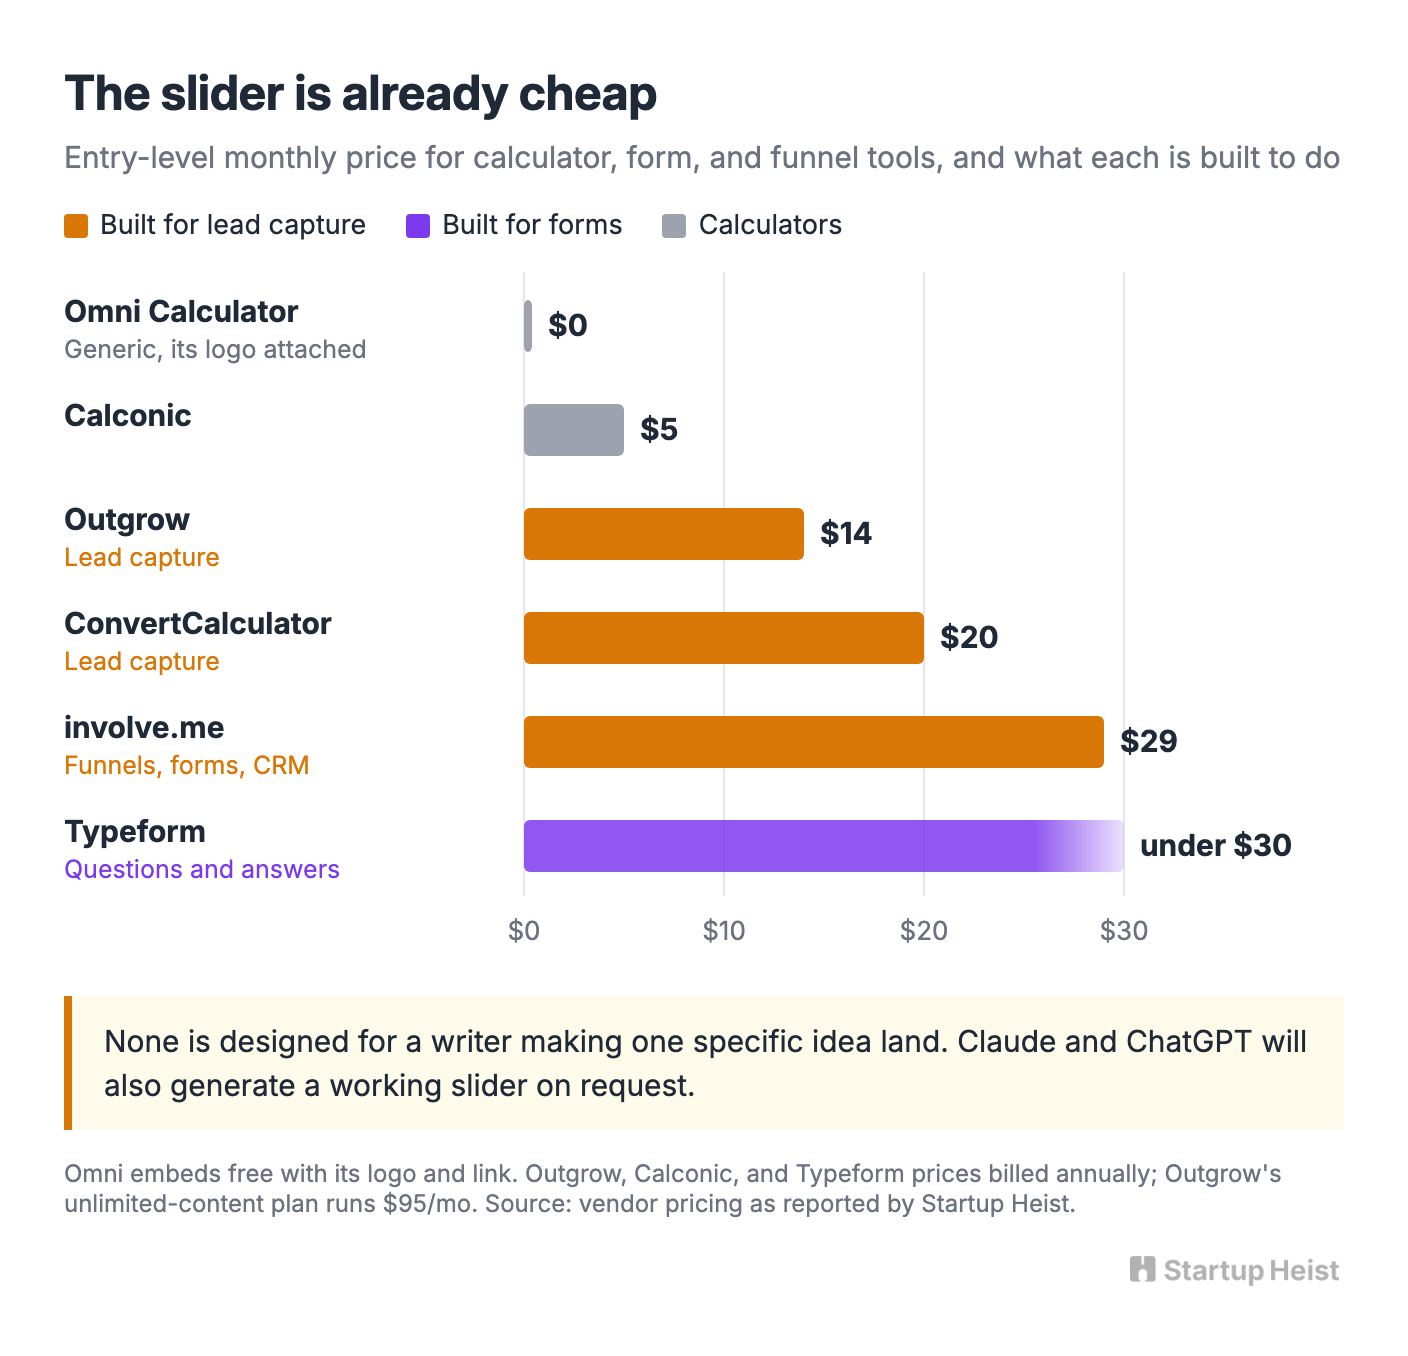
Look at what those products are built to do, though. involve.me sells itself on funnels, forms, CRM, and automated email sequences, and Outgrow and ConvertCalculator compete for the same lead-capture budget. Typeform is built around questions and answers. Omni hands you a generic calculator carrying its own logo, explaining nobody's argument. An AI-generated widget gives you code with untested math, no email preview, no analytics, and no promise it will still load in three years. None of them is designed for the writer whose job is to make one specific idea land with a reader, and competing with them on the price of a slider means fighting on the one front where you're already beaten.
Unlock the Vault.
Join founders who spot opportunities ahead of the crowd. Actionable insights. Zero fluff.
“Intelligent, bold, minus the pretense.”
“Like discovering the cheat codes of the startup world.”
“SH is off-Broadway for founders — weird, sharp, and ahead of the curve.”


